Statistics: Divorce
Here's my summary...
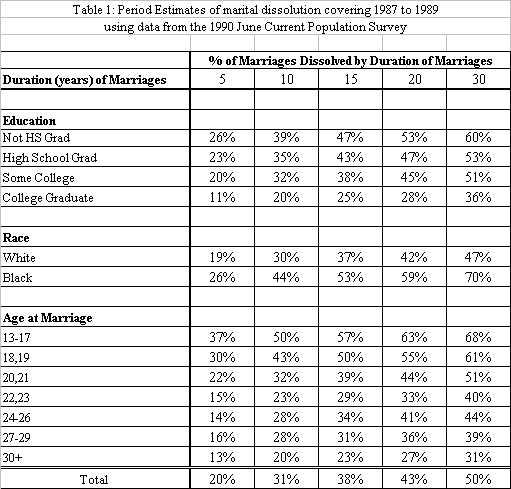
Raley and Bumpass estimate it to be about 50%, and believe that current statistics don't show the true level of maritial instability that's occuring in the U.S. They use some sophisticated demographic techniques to prove their point, which I won't go into right now. The caveat is that their data is based on marriages in the 1980's, based on data published in 1990. Divorce rates has been slowly but steadily declining since then, so I'm inclined to believe that the more accurate divorce number is nearer to 40%.
However, the far more interesting story is the wide range of divorce rates among different groups.

As you can see, the chances of getting divorced if you marry at or after the age of 30 is only 31% over the course of 30 possible years of marriage. The chances of getting divorced if you marry and are black are 70% over the course of 30 possible years of marriage. That's a huge difference.
Looking at these numbers, its clear that divorce varies widely by demographic group. But its important to look at the details behind the numbers.
First, its important to keep in mind that coorelation in not causation - being black doesn't necessarily cause you divorce more often, any more then having a college degree causes you to have a more successful marriage - but black people as a group share some set of factors which lead to a higher divorce rate, and educated people as a group share some set of factors which lead to a lower divorce rate. What are those factors? I don't know. But this data suggests some possibilites of where to look.
Second, (and this is not reflected on the chart) only 1-2% of all divorces occur after 30 years of marriage. Reading this chart naively, you may conclude that the older you get, the more likely you are to divorce. The opposite is true. Each year, there is a risk that a married couple may divorce. That risk decreases each successive year of marriage - the longer you've been together, the less likely it is that you'll break up compared to a couple that has only recently married.
But the cumulative chances of divorce increase each year. It works the same way as calculating mortality:
Let's say that out of 1,000 children, 10% die of malaria between ages 0-4. Well, of the 900 children that are left, 9% of them die of malaria between ages 5-9. By age 10, we have 819 children left, which would appear on the chart as being a 18.1% chance of death (819 divided by 1,000 equals 81.9% chance of survival, or 18.1% chance of death) by malaria for children age 0-9, even though the chances of any individual child surviving increases as they get older.
There's a lot more interesting data in their report, and I'll blog about it when I get the chance.
posted by SomeGuyInDC @ 6:42 AM
|
![]()
![]()


